


 Menu
Menu  Search
 SoS home > Charities & fundraisers > 2016 annual report > Table of contents > Trend analysis
16. Trend Analysis
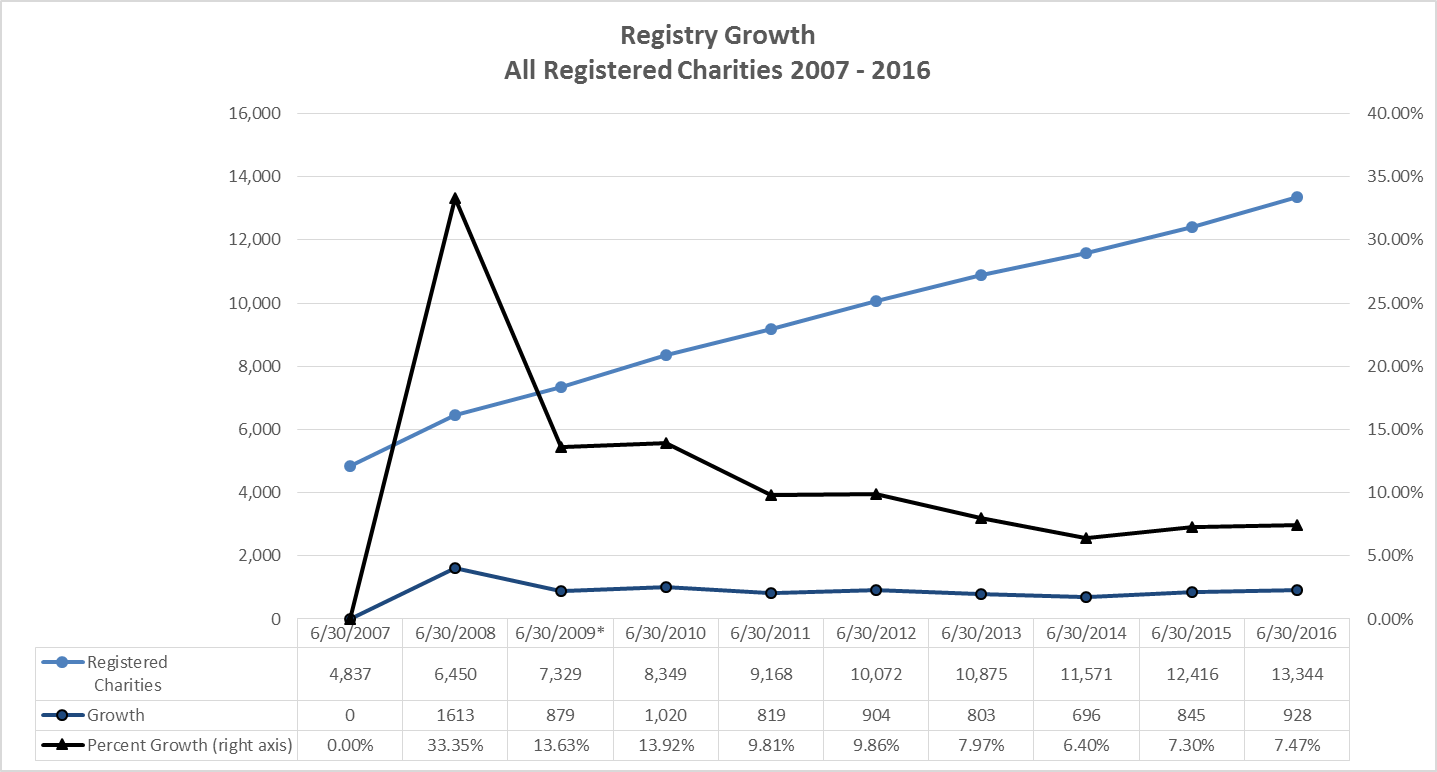
Registry growth
The graph below depicts the growth in registered charities in Colorado over the past decade. As of the fiscal year ending June 30, 2016, 13,344 charitable organizations were registered to solicit contributions in Colorado (as of Nov. 30, 2016, the number had grown to 13,717). Growth has averaged approximately 7% over the past three years, and the database is almost three times larger than it was in 2007.
Text version of the registry growth chart
Click on the image to see a full-sized version.
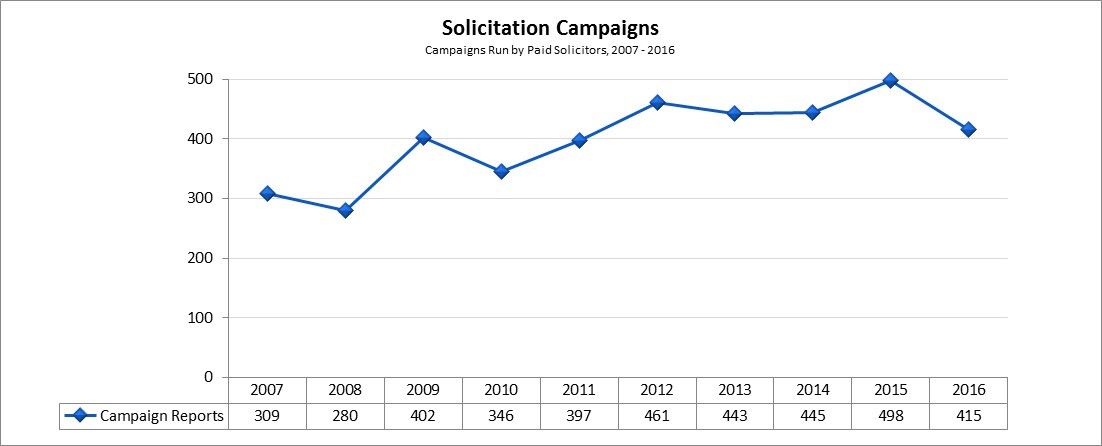
Solicitation campaigns
The total number of solicitation campaigns run annually by paid solicitors. The number of campaigns decreased 17% in 2016.
Text version of the solicitation campaigns chart
Click on the image to see a full-sized version.
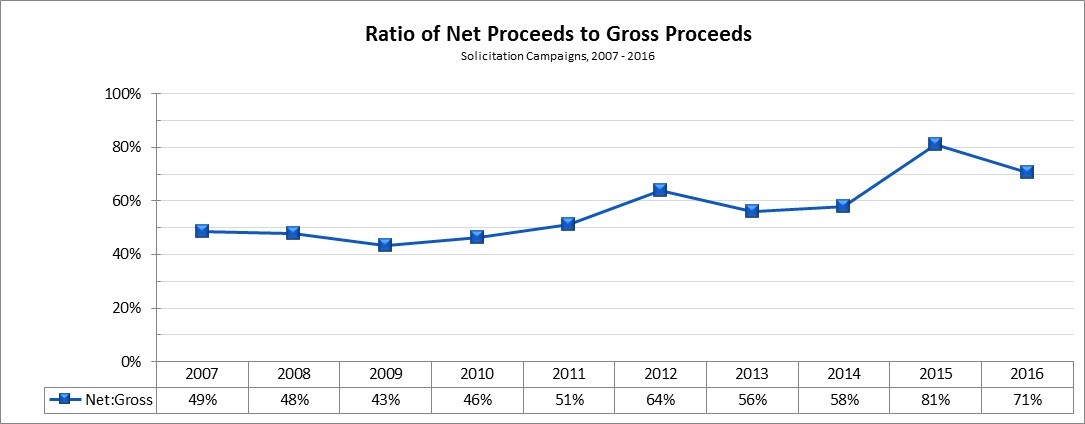
Ratio of net proceeds to gross proceeds
The percentage of gross receipts (donations) raised by paid solicitors that makes it to the charity as net revenue, after paying the expenses of the campaign and the paid solicitor’s fee. The percent to charity decreased by 10% in 2016. The average percent to charity over the previous ten years has been 57%.
Text version of the ratio of net proceeds to gross proceeds chart
Click on the image to see a full-sized version.
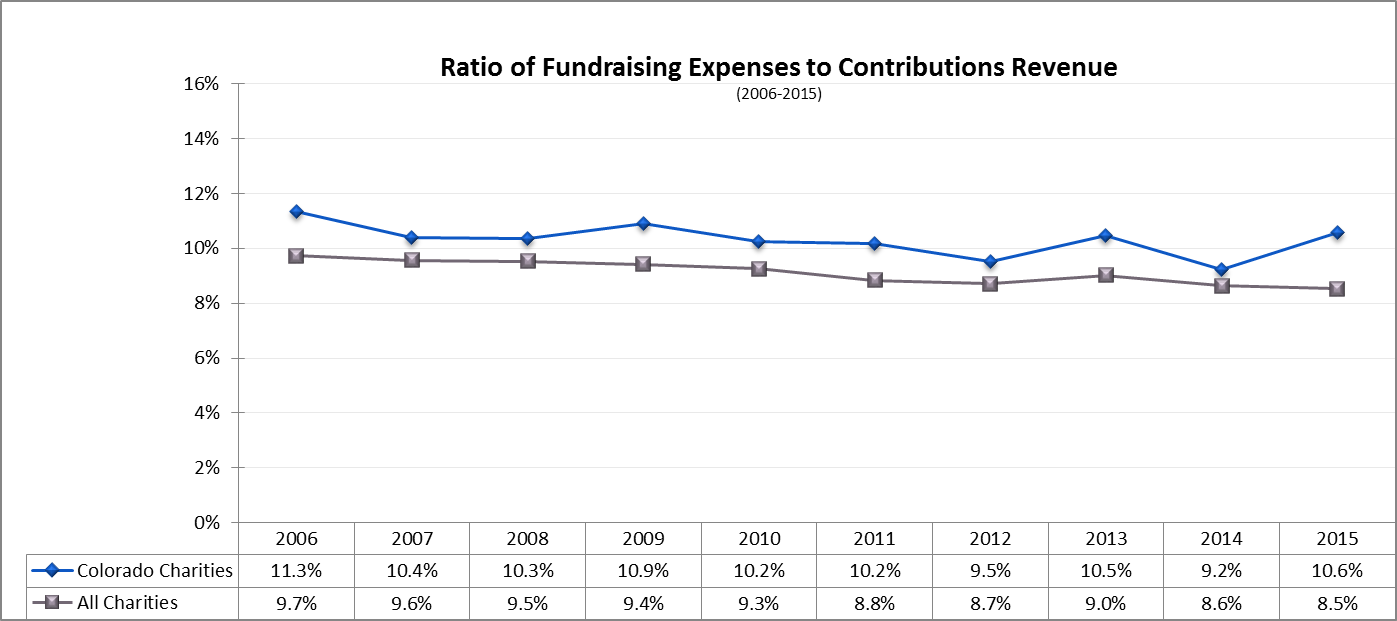
Ratio of fundraising expenses to contributions revenue
These graphs compare the ratio of fundraising expenses to contributions revenue for all registered charities and for registered charities listing a Colorado principal address. The results show that on average charities raise contributions in an effective manner, with Colorado charities spending slightly more on average than all charities combined. This could reflect some economies of scale that charities realize when raising funds on a regional or national basis.
Text version of the ratio of fundraising expenses to contributions revenue chart
Click on the image to see a full-sized version.
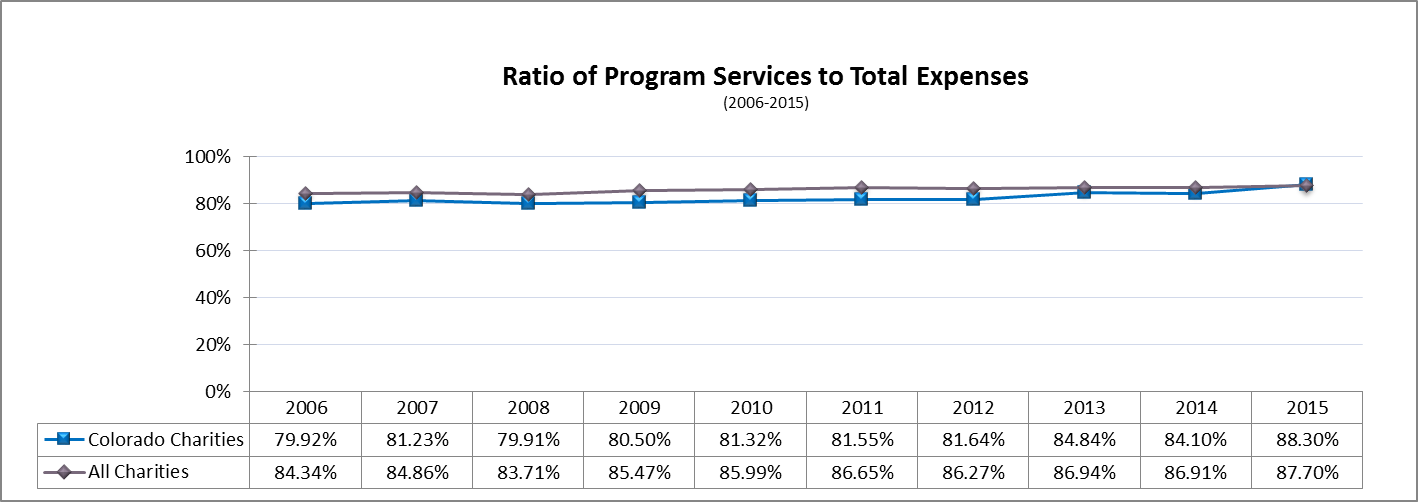
Ratio of program services to total expenses
These charts compare the ratio of program service expenses to total expenses for all charities registered and for all charities listing a Colorado principal address. The results show that on average charities devote a large percentage of their spending to their programs, with Colorado charities spending slightly less on average than all charities combined.
Text version of the ratio of program services to total expenses chart
Click on the image to see a full-sized version.
Methods of solicitation
This chart shows the prevalence of various methods of soliciting contributions as reported on 415 solicitation campaign financial reports. Organizations often use more than one method, in which case all methods are counted in the totals.
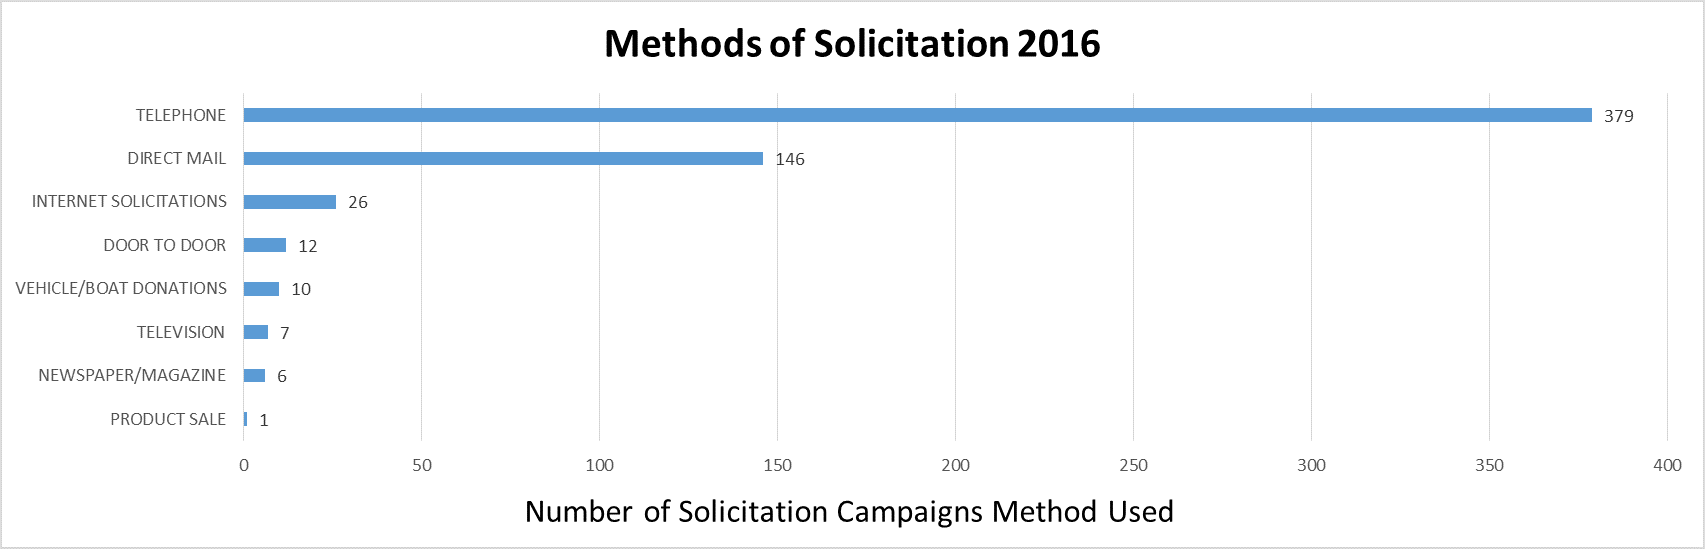
Click on the image to see a full-sized version.